Improving Management of Tar Spot – a Fungicide Timing Trial
By: Marty Chilvers, Adam Byrne and Jill Check - Dept. of Plant, Soil and Microbial Sciences, Michigan State University
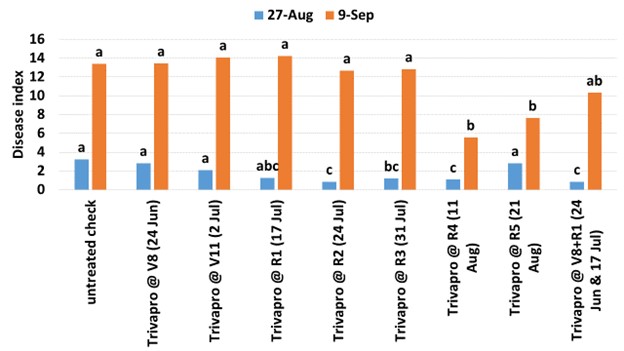
A fungicide study was conducted to determine treatment timings that maximize disease control and to provide data for development of a tar spot disease model (Tarspotter). The chart below illustrates the amount of disease recorded on the ear leaf at two time points during the season. Tar spot was first detected in this irrigated field on July 16 at very low levels, with a rapid increase in disease severity during August and September. On August 27 (blue bars) it was apparent that fungicide applications on July 24 (R2), July 31 (R3) and August 11 (R4) resulted in lower levels of disease, while those applied earlier and later did not differ from the untreated check. On September 9 (orange bars), almost two weeks later, the amount of disease on the ear leaf had increased substantially, the only treatments significantly different from the untreated check were those applied on August 11 (R4) and 21 (R5), indicating that the residual fungicide from earlier timings was no longer effective. No significant differences were found in yield between the treatments; however, July 17 (R1) application had the highest numerical yield. Although there is still much to learn about optimizing fungicide timing it appears as though most vegetative applications are too early, given that the disease typically escalates during mid to late reproductive stages. A fungicide efficacy trial conducted in the same field demonstrated that all products significantly reduced tar spot development when applied on July 17 (R1). Although yield differences were not detected at this location these two trials are part of a larger multistate effort that will help in understanding fungicide timing, efficacy and ROI of tar spot management.